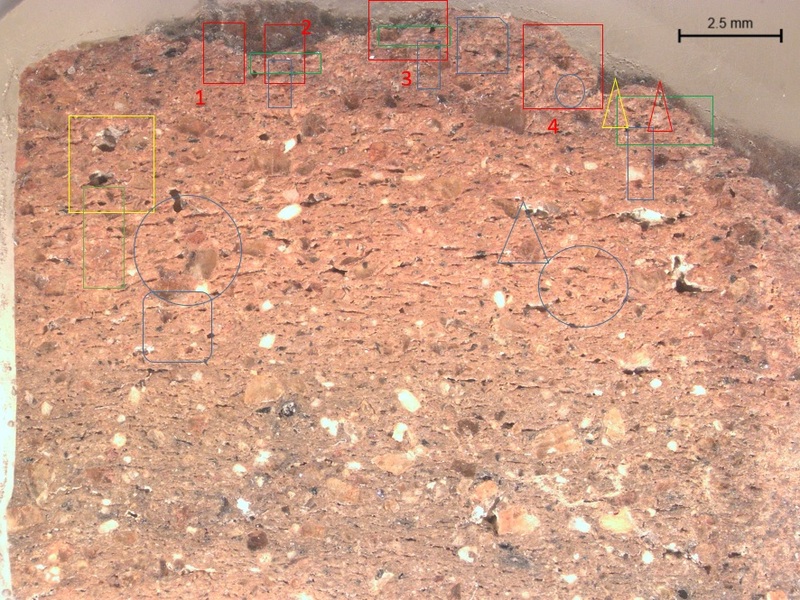
TT1_OM_for_SEM_Image_1
Media
Part of AF TTK 001 OM for SEM acquisition
- Title (Dublin Core)
- TT1_OM_for_SEM_Image_1
-
Being at the edge of the section, at the limit of the sample holder, it is not possible to take pictures of the coating in an optimal way
at 50x to understand if it makes sense to analyze the matrix, heterogeneous stuff will come.
Greater contrast between the upper limit surface and the matrix, the upper limit seems finer.
50x general images of the coating: Areas 1,2,3,4
In zone 2
- At 200x, in the middle of the hypothetical coating general analysis (green box) = presence of 16% of Fe Area 1.
- At 200x continuing vertically (blue box), less Fe Area 2 emerges from the analysis.
In zone 3
- At 200x, in the middle of the hypothetical coating general analysis (green box) Area 3.
- At 200x continuing vertically (blue box) from the analysis it emergesin least Fe 10%, Al 23%, P 0.63% Area 4.
Right side zone 4:
- Green box surface layer analysis 19.28% Fe Al 19% Area 5.
- Presence of proportional phase shift between Al and Fe: intentional addition of Fe.
- Blue box 26% Al, 11% Fe, 55% Si (always Fe and Al inversely proportional) Area 6.
- Yellow box: Area with different texture, the presence of 9% of Fe is noted, the Si 66% increased a lot (due to the presence of a lot of qz) 20% of Al Area 7.
- Going below the yellow square, along the green square the Fe continues to decrease and to Al, the Si increases. Area 8
- Matrix analysis at 500x.
- Going down below the green box we always notice an increase in Si due to the presence of large grains of qz, and low Si and Al.
Round: 13% Fe 28% Al 53% Si matrix.
- Under round coating in 4: Al 27% Fe% 11 Si 3% at 200x.
- Big circle on the right: 10% Fe Al 26% Si 57%.
- Beveled box = 11% Fe 57% Si 26% Al.
- Triangle 12% Fe 28% Al 53.

